Engineering a Fundable Narrative: Integrating Institutional Data for Workforce Grants
November
2026
Volume:
29Number:
11Learning Abstracts

Community colleges often face a difficult reality in their pursuit of workforce development funding. Program proposals that align well with regional economic needs and enjoy broad internal consensus may still fail to attract grant support. The root cause of this rejection often is not the quality of the proposed programs, but the fragmentation of the evidence required to justify them. Institutional research (IR) and institutional effectiveness (IE) units are custodians of the exact data funders seek—enrollment trajectories, credential attainment metrics, and regional hiring forecasts. The difficulty is that this information is typically locked within unconnected technology platforms, preventing the assembly of a unified case. The colleges that consistently succeed in grant competitions are not defined by better program designs, but by a capacity to merge disparate data streams into a single, persuasive application. This article proposes a redefinition of the data professional’s role, from a compiler of static reports to an architect of evidence pipelines that make institutional impact visible.
The Challenge: Fragmented Evidence for Workforce Initiatives
Most postsecondary institutions already possess the fundamental components required to validate a program’s potential. Student administrative systems, credential verification databases, and third-party economic modeling tools each contain a fragment of the total story. The missing element is an integration mechanism that can weave these isolated fragments into a coherent and externally facing justification. The consequence of this gap is not mere inconvenience, but the stagnation of meritorious projects that cannot demonstrate their anticipated return on investment.
This dynamic was directly observed during the planning of an advanced manufacturing initiative at the College of Southern Nevada (CSN). Academic and strategic leadership sought to launch an electric vehicle (EV) maintenance program, an endeavor well-suited to a metropolitan area working to broaden its economic base beyond the leisure and hospitality sector. The conceptual alignment with both community need and labor market trends was strong; however, the quantitative evidence was partitioned across three unconnected repositories. Student academic histories and enrollment figures were maintained in the PeopleSoft enterprise resource planning system. Records of industry-recognized credential attainment were tracked in a separate application, Lumens. The crucial external component—verified statistics on regional job postings and growth projections for EV technicians—was accessible only through a standalone portal, Lightcast, which operated entirely outside of internal reporting workflows.
When evidentiary components are isolated in this fashion, institutional responses typically bifurcate into two suboptimal paths. One path relies on manually compiled data extracts that are temporally fragile, reflecting a single point in time and becoming obsolete when a funding agency requests updated or differently segmented information. The other path produces a multiplicity of isolated visual displays that are seldom examined in conjunction, meaning that the narrative of student achievement never converges with the narrative of market opportunity. At CSN, a curriculum projection estimated to generate $10 million in regional economic impact remained confined to the conceptual phase. The barrier was not a deficiency in the program’s logic, but the absence of the technical conduit needed to channel operational records into a fundable proposition.
A Method for Integrated Evidence Assembly
Addressing this structural fragmentation required moving beyond a project-based reporting mentality and toward a systematic, layered methodology for data integration. The approach that resolved the impasse can be replicated by any institutional analytics unit facing comparable technological silos.
Figure 1: Three-Layered Data Pipeline Architecture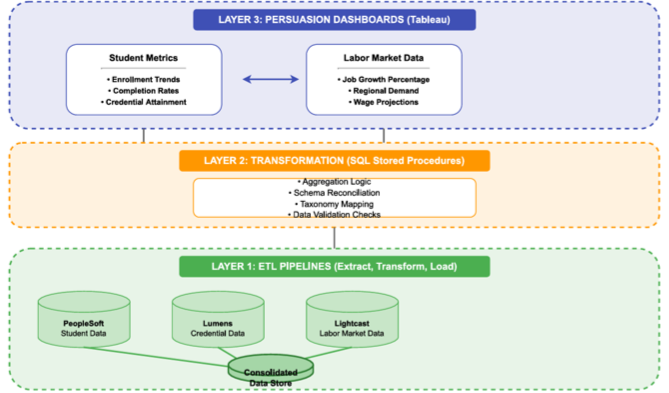
The foundational layer requires the construction of automated extract, transform, load (ETL) routines that do not simply copy data, but actively harmonize it. Over a dozen such ETL sequences were developed to extract information from the Lightcast platform, the PeopleSoft student system, and the Lumens credentialing application, depositing the results into a consolidated analytical environment. The most significant technical hurdle was not extraction, but the semantic reconciliation of incongruent classification schemes. Lightcast’s occupational taxonomies, for instance, had to be algorithmically mapped to the college’s internally defined program codes so that records from different sources could be meaningfully joined, rather than merely co-located.
The intermediate layer relocates complex data transformation from the presentation tier into the database management system. A common misstep in analytics projects is embedding transformation logic directly within data visualization software. This practice creates fragile dependencies and complicates long-term maintenance. The remedy implemented here involved encoding all aggregation, calculation, and data shaping operations within SQL stored procedures that executed prior to any connection with the visualization tool. This architectural choice ensured that the subsequent visual displays were performant, consistent, and, most importantly, regarded as an authoritative source by decision-makers.
The presentation layer demands that visual interfaces be designed with a primary objective of external persuasion, supplementing their internal monitoring function. This represents the principle most frequently neglected. The visual analytics dashboards created for this project were not configured merely to track internal metrics. Rather, they were intentionally structured to address the implied question of a grant reviewer: Why should capital be allocated to sustain or expand this initiative? To this end, student progression indicators were juxtaposed directly with corresponding regional employment forecasts, recasting the dashboard from a passive monitoring device into an active instrument of advocacy.
Throughout development, a critical maintenance consideration was the volatile nature of third-party data. External analytics providers, such as Lightcast, issue updates on independent schedules and organize information according to their own evolving classification standards. If a data infrastructure lacks automated validation checkpoints to detect when external job groupings diverge from internal program definitions, it will eventually surface conflicting figures to institutional leadership. Such discrepancies do not simply damage a single data point; they systematically undermine confidence in the entire analytical framework.
Outcomes and Institutional Consequences
The integration of internal student success data with external labor market intelligence fundamentally altered the institution’s ability to compete for external resources. Once the pipeline was operational, CSN could definitively illustrate, with internally consistent and externally verifiable data, that regional demand for EV service technicians was both current and projected to accelerate, and that the proposed training program was calibrated to meet that precise demand. This synthesized evidentiary package was incorporated directly into the college’s federal grant acquisition strategy, converting a narrative pitch into a substantiated investment prospectus for a program with a projected eight-figure regional economic footprint.
The resulting organizational shift is best understood as a transition in the function of the data unit. A reporting-focused team retroactively describes institutional activity. An evidence-engineering team proactively generates the leverage required for strategic advancement, furnishing grant writers and academic planners with the integrated proof points needed to secure competitive awards.
Recommendations for Initial Implementation and Future Scaling
Funding agencies do not underwrite projects based on compelling anecdotes or unvalidated good intentions. They make awards to institutions that can furnish proof, derived from reconciled internal and external data, that a proposed activity represents a prudent investment. For IR and IE units ready to initiate this transformation, the optimal strategy is one of deliberate, incremental implementation.
The recommended starting point is to select a single, high-priority program as a proof of concept. The next activity is to precisely map the locations of its student-level performance records and the independent market intelligence that validates its occupational targets. The final, transformative action is to construct a single data pipeline that establishes a durable, queryable connection between those two sources. That one integration artifact will deliver more persuasive force for the next major funding cycle than any collection of manually refreshed presentations. Subsequent phases of this work will extend the pipeline architecture systematically to additional workforce programs across the institution, cultivating a permanent organizational competency in converting fragmented operational data into cohesive evidence that attracts external investment.
Pratham Yadav is a Grants Analyst at College of Southern Nevada in Las Vegas, Nevada.
Opinions expressed in Learning Abstracts are those of the author(s) and do not necessarily reflect those of the League for Innovation in the Community College.