


Applying Research to Close Gaps in College Economic Outcomes
March
2025
Volume:
20Number:
3Innovation Showcase
Whether or not college pays off financially, and to whom, is an increasingly important question for institutions of higher education and their students. Career reasons are top motivators for students when deciding to enroll in postsecondary education, yet public perception has declined for the past five years regarding whether college is worth the cost (Lumina Foundation, 2023; Nguyen et al., 2024). This issue is especially salient for community colleges, underscoring the need for robust evidence that students of all backgrounds can attain positive post-completion career outcomes.
Measuring and enhancing higher education’s value proposition to students requires sound research. Launched in 2022, the Research Institute at Dallas College is a higher education research team that uses mixed methods and longitudinal data to examine students’ educational and career trajectories. Envisioned as an action research group embedded within one of the largest community colleges in the United States, the Research Institute has, since its founding, conducted several studies focused on analyzing the post-completion economic outcomes of Dallas College students. These include projects focused on return on investment, debt to earnings, and economic mobility, with a unique community college-centered perspective (Dallas College, 2022a, 2022b, 2023).
In addition to directly addressing concerns about college value to prospective students, applied research on student economic outcomes offers promise to college administrators across many domains, such as program review, career services, strategic planning, and continuous improvement. However, with these opportunities come unique challenges. A variety of data sources and success criteria exist to evaluate student economic outcomes, each with their own nuances and tradeoffs. This article describes how the Research Institute at Dallas College has navigated these considerations, leveraging a tapestry of data sources to research, identify, and close outcomes gaps.
Gathering Data
College leaders striving to understand their students’ post-completion economic outcomes often seek to answer simple questions about their graduates. Are they employed? Are they working within their field of study? Are they earning a livable, sustainable wage? Is their student loan debt manageable relative to their earnings? And, how do outcomes vary by program and population? Yet, gathering the data needed to answer these questions is often more complicated.
A large body of literature broadly links educational attainment to economic success (Lovenheim & Smith, 2022). However, community college leaders and faculty members typically need more than general evidence of the importance of education; their roles demand institution- and program-specific outcomes data that are often difficult to acquire and subject to limitations. Such data span a complex web of federal, state, local, and private sources (Harmon, 2021). Our focus here is on economic outcomes data, although we note that transfer data—for example, from the National Student Clearinghouse—is also critical to comprehensively capture student outcomes. Table 1 compares common data sources for economic outcomes assessment.
Table 1: Selected Data Sources for Economic Outcomes Assessment
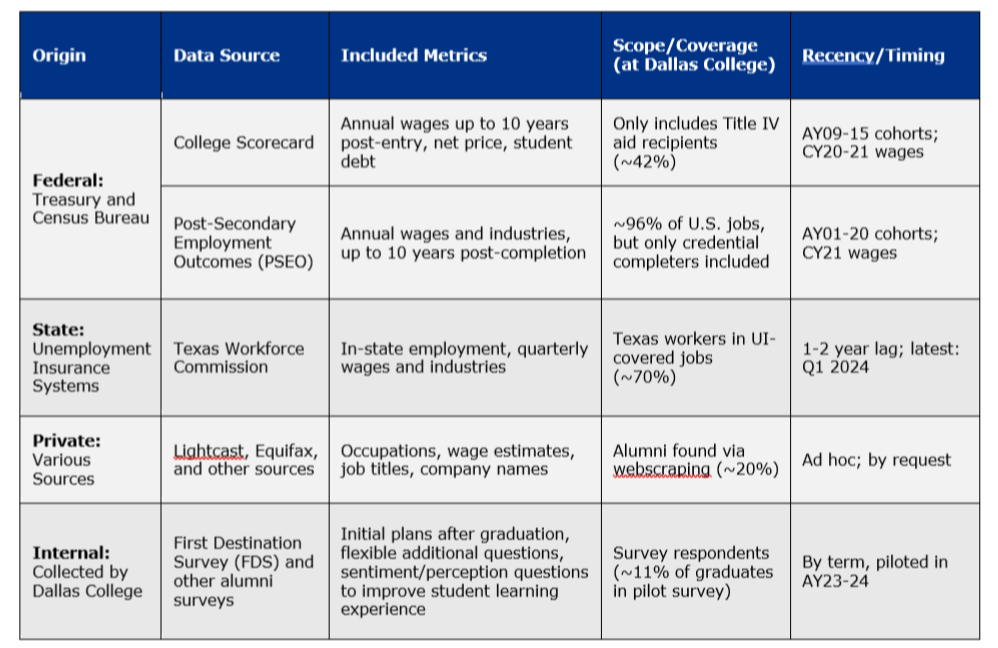
Earnings are one of the most common measures of students’ post-completion economic success, with federal data sources like the College Scorecard and Post-Secondary Employment Outcomes Explorer publishing institution- and field-specific median earnings data. These sources offer wide coverage across institutions—useful for benchmarking—but the data within cannot be disaggregated to an individual student level, limiting their effectiveness for analyses by student population; academic performance; and engagement with activities, services, and resources during enrollment.
State data, from state labor departments and longitudinal data systems like the Texas Workforce Commission and Texas Education Research Center, track earnings down to the individual student using unemployment insurance (UI) records, enabling richer analyses. However, access to these data at postsecondary institutions is highly restricted for privacy reasons, and students who move out of state or are self-employed are often excluded. While efforts like those of the Coleridge Initiative seek to combine data from multiple states to better capture student outcomes, not all states participate. State data capture employer-reported wages and industries well but are less effective in gauging the outcomes of students who work as independent contractors or laborers and in trade professions. Furthermore, UI records typically do not include occupation codes, which limits our ability to determine whether outcomes are associated with working in a student’s field of study.
Other data sources include private third-party providers such as Lightcast. Lightcast scrapes the web for a college’s alumni profiles on job networking sites (e.g., LinkedIn), then estimates alumni wages by mapping their self-reported job titles to the typical earnings associated with related occupations using data from the Bureau of Labor Statistics. This novel approach allows institutions to assess whether students are employed in jobs related to their fields of study based on job title, but the set of students who can be matched via webscraping—between 20-30 percent at Dallas College—may be more professionalized and not fully representative of the institution or its programs as a whole.
Finally, institutions can also collect their own data directly from students via exit or alumni surveys. The National Association of Colleges and Employers offers standard questions and best practices for institutions seeking to implement a First Destination Survey (FDS). Such surveys can provide unique insights into alumni sentiment because the questionnaires are highly customizable; the combination of quantitative and qualitative input from survey data and follow-up interviews or focus groups can potentially be used to improve the student learning experience. In addition, survey data are reported in a timely manner, allowing college staff to reach out to students who are still searching for their next career or educational opportunity. However, survey data are self-reported, potentially introducing error, and participation and representativeness can also be sources of bias.
Overall, post-completion economic outcomes data come from a variety of sources, each with its own advantages and disadvantages. The Research Institute at Dallas College coalesces data from each of these sources for a holistic assessment of our students’ post-college economic wellbeing. We use FDS data for an initial look at student outcomes and cross-check these against state UI data. By taking a patchwork approach, we seek to improve our knowledge rate, or the share of graduating students for whom we have data about post-graduation employment, education, and other activities.
Defining Success
Gathering economic outcomes data is a significant lift for community college practitioners. But equally important, and often equally challenging, is deciding how to define economic success. What success means may differ across institutional contexts, and a variety of approaches to evaluating student economic outcomes have been proposed, including job placement rates, earnings thresholds, debt-to-earnings ratios, and time to recoup educational costs. To complicate matters, even within a single category, such as earnings thresholds, suggested standards vary; for example, should a college completer earn at least a living wage, at least as much as someone with a high school diploma alone, enough to pay down student loan debt, or some other amount?
Fortunately, several frameworks exist which offer guidance on gauging post-completion success. The Postsecondary Value Commission (2021) proposed several economic value thresholds based on earnings and wealth, including minimum economic return, earnings premium, earnings parity, economic mobility, economic security, and wealth parity. Mathematica’s (2023) Education-to-Workforce Indicator Framework adopted minimum economic return, economic mobility, and economic security, also adding student loan repayment and employment in a quality job. The Aspen Institute’s leadership envisions community college 3.0 being focused on access, completion, and post-college success (Wyner, 2016). The institute lists median earnings, employment rates, cohort default rates, average student debt, applied learning participation, high-value program enrollment and workforce/CTE awards, and passage of licensure exams as measures of student success in the workforce (The Aspen Institute, n.d.). The Strategic Data Project’s (2024) Education to Workforce Pathways Diagnostic Toolkit, which focuses on the state level rather than the institutional level, suggests using living wages—for example, from the MIT Living Wage Calculator—to assess earnings after college. Table 2 curates the success criteria that we believe are the most salient and tractable with currently available data.
Table 2: Selected Economic Indicators of Student Success
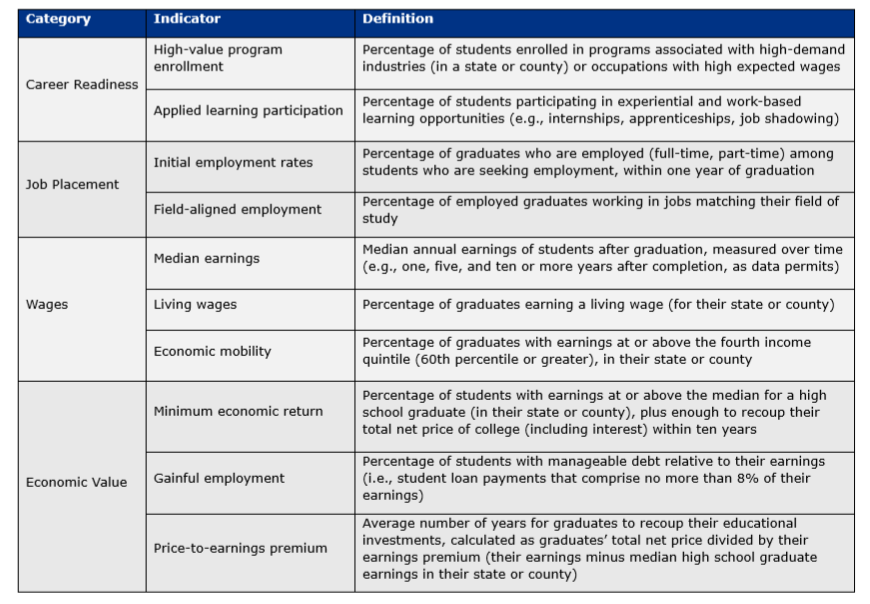
These are just a few of the examples of how institutions can define post-college economic success. Other measures include return on investment as calculated by the Georgetown University Center on Education and the Workforce, the price-to-earnings-premium used by Third Way and the HEA Group, and debt-to-earnings ratios used for Gainful Employment regulations (Itzkowitz, 2020, 2024; Carnevale et al., 2019). There is no shortage of ways for institutions to define post-completion success. Just as with data sources, it’s possible to take an all-of-the-above approach, although different success criteria demand different kinds and amounts of data—something likely to be difficult for community colleges still seeking to develop their outcomes monitoring. As a starting point, the Research Institute at Dallas College suggests using living wage thresholds as the standards for economic success. These values are updated annually, county-specific, and require only earnings data to use. Readers can access the Research Institute’s Value of College Dashboard to quickly compare their own institutions’ earnings data from the College Scorecard to living wage cutoffs for their county.
Closing the Gaps
Finally, college leaders need to understand how economic outcomes data can be used to close outcomes gaps. While it is true that some economic factors are outside of institutions’ control, college leaders can be responsive to local industry needs and hiring demand. Likewise, college staff can offer career support to students, especially to those from groups with adverse wage outcomes. In order to provide this type of targeted assistance, disaggregating economic outcomes data is key.
Colleges must consider not just the share of their overall population earning living wages post-college, but the shares by cohort, first-generation status, Pell eligibility, and age, among other characteristics. In addition, it is important to disaggregate data by program or field of study, both to understand which fields offer the greatest financial value and to assess how representation in high-demand fields varies by student group. Disaggregating data in this way allows us to better diagnose and address underlying disparities. For example, earnings may vary due to underrepresentation in lucrative fields like STEM due to limited awareness, academic preparedness, and other factors, but may also vary among STEM alumni due to uneven in-field job placement rates.
At Dallas College, the Research Institute is striving to evaluate this data on an annual basis as part of a broader culture of assessment within our institution. As we work to study students’ economic outcomes with increased granularity using a combination of data sources, we hope our experience offers a template that can be utilized and advanced by other community colleges.
References
Carnevale, A. P., Cheah, B., & Van Der Werf, M. (2019). Ranking ROI of 4,500 US colleges and universities. Center on Education and the Workforce, Georgetown University. https://cew.georgetown.edu/cewreports/collegeroi
Dallas College. (2022a). Does community college pay off? Research Institute. https://storymaps.com/collections/05acb8332bd54f7cb9b8bfd52ebdc2fe?item=20
Dallas College. (2022b). EMI2: An economic mobility index for two-year colleges. Research Institute. https://www.dallascollege.edu/about/research-institute/Documents/emi2-report.pdf
Dallas College. (2023). Debt and earnings at Dallas College: A review of programs in state and national context. Research Institute. https://storymaps.com/collections/83fb5f7e2e1b43a88be6a2611423bca4?item=6
Harmon, T. (2021). The current state of earnings data: State definitions of earners and private earnings data sources for institutions. Postsecondary Value Commission. https://www.postsecondaryvalue.org/wp-content/uploads/2021/10/PVC_Harmon.pdf
Itzkowitz, M. (2020). Price-to-earnings premium: A new way of measuring return on investment in higher ed. Third Way. https://www.thirdway.org/report/price-to-earnings-premium-a-new-way-of-measuring-return-on-investment-in-higher-ed
Itzkowitz, M. (2024). California college programs that pay: Measuring return on investment across majors and credentials. The HEA Group. https://www.theheagroup.com/blog/college-programs-that-pay
Lovenheim, M., & Smith, J. (2022). Returns to different postsecondary investments: Institution type, academic programs, and credentials (NBER Working Paper No. 29933). National Bureau of Economic Research. http://www.nber.org/papers/w29933
Lumina Foundation. (2023). Education for what? The workforce impact of higher education. Lumina Foundation. https://www.luminafoundation.org/wp-content/uploads/2023/08/Education.for_.What_.pdf
Mathematica. (2023). Education to workforce indicator framework: Using data to promote equity and economic security for all. https://www.educationtoworkforce.org/sites/default/files/2023-04/E-W-Indicator-Framework_Final.pdf
Nguyen, S., Fishman, R., & Cheche, O. (2024, July 30). Varying degrees 2024: New America’s seventh annual survey on higher education. New America. https://www.newamerica.org/education-policy/reports/varying-degrees-2024
Postsecondary Value Commission. (2021). Equitable value: Promoting economic mobility and social justice through postsecondary education. https://live-postsecondary-value-commission.pantheonsite.io/wp-content/uploads/2021/07/PVC-Final-Report-FINAL-7.2.pdf
Strategic Data Project. (2024). Education to workforce pathways diagnostic toolkit. Center for Education Policy Research, Harvard University. https://sdp.cepr.harvard.edu/sites/hwpi.harvard.edu/files/sdp/files/education_to_workforce_pathways_analysis_guide.pdf?m=1717165072
The Aspen Institute. (n.d.). College Excellence Program focus areas: Workforce. https://highered.aspeninstitute.org/focus-areas/workforce
Wyner, J. (2016, November 14). Community College 3.0: What’s next for the student success agenda? [Video]. The Aspen Institute. https://vimeo.com/191737582
Lead image: Dallas College Research Institute team members
Navi Dhaliwal is Director, Economic Research and Data Strategy, and David Mahan is Founding Executive Director, Research Institute, at Dallas College in Dallas, Texas.
Opinions expressed in Innovation Showcase are those of the author(s) and do not necessarily reflect those of the League for Innovation in the Community College.